Dear Fissure Friends,
I recently read the book “The Drunkard’s Walk, How Randomness Rules Our Lives”, By Leonard Mlodinow. In the book, Mlodinow introduces many real-life situations and then talks about the odds or probability of the potential results. He actually gives a great history of the development of mathematics and how much of it was driven by studying and trying to understand and predict games of chance (gambling). It’s a very good book on randomness and statistics; topics I didn’t do so well in while in college. My challenge in learning probability and statistics was “seeing” how to apply what I was learning to real life. Making it applicable is something Mlodinow does very well in his book through relevant stories and examples.
As a project manager or team member, it is important to have a good understanding of statistics and probabilities to do a good job of project estimation and risk management, but that is not what I want to talk about here. We have workshops for that. 
For me, one of the more eye opening topics in the book had to do with distributions. How, over time, very good and very bad results can be explained by the mere fact that most situations have so many unpredictable and uncontrolled factors that a wide range of results is inevitable. I know you’re thinking this is a pretty basic concept for an instructor of project estimation and risk management, and it is. The eye opening part for me was his contention that extraordinary results can be expected over time, and that the person who got those results was, for the lack of a better description, just lucky. One of his examples was the 61 homeruns Roger Maris hit to break Babe Ruth’s record. In his analysis of hitters and homeruns over the relevant time span he determined, based on probabilities, that it was reasonable to assume someone would break Babe’s record. He also points out that Maris never came close to 61 homeruns before or after his record breaking season. In another example he talks about a stock broker who has had an unbelievable good streak of beating the average market return. He explains the streak and how that performance still falls within the expected distribution of performance for all stock brokers over the time period. This broker just happened to be the one who was lucky enough to be on the “tail of the distribution” of all stockbroker results!
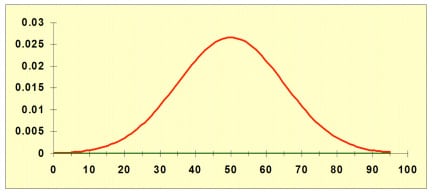
Just a lucky streak for both Maris and the broker? That is where I struggled with his conclusions and I’m sure many of you are already thinking about writing me to explain both Maris’s season and the broker’s streak. Please send your rebuttals to Mlodinow, not me. Where he really struck close to home was his question of the practice of replacing the successful coach or leader after a few losing years or seasons. He questions the current wisdom that they have lost their “touch” and proposes that it was just the many other factors that lined up against the leader to give them a losing season or year, or two, or three. In reading Mlodinow’s book I had the impression that he was underestimating the influence of the leader in comparison to all the other factors that can influence results. Now as a sports fan, student of leadership, trainer of leadership, and a small company leader myself, this caused me to spend some time contemplating the question: How much influence does a leader have on the results of their organization? After thinking about my own experiences and knowledge of many leaders, I respectfully disagree with Mlodinow and would be willing to bet that most leaders don’t realize just how much influence (good and bad) they really do have on their people and organization. I agree that the yearly results will vary greatly independent of the leader, and some factors like our current economic downturn can have a huge impact on an organization’s results, but I think Mlodinow would agree that each leader can have vastly different “measures of central tendency”. Measures of central tendency is a statistical term meaning the results of a process will group around a center point of the complete distribution of the results. Below is an example of a distribution where the center is pretty obvious.
Relating this to leadership, good leaders will get better results than bad leaders most of the time over the same time period. But as Mlodinow pointed out in his book even very good leaders can have a bad result, while very bad leaders can have a very good result. Many of you know Mike Wold, one of our leadership instructors. What you probably don’t know is that while working for a major computer company, Mike was nominated for a very prestigious leadership award given each year to the manager in the company who represented the very best in leadership. Mike was and is an excellent leader and during his time at this company he was usually very successful in managing his projects, but there was one project in particular that no matter how hard he managed and how well he led, it did not turn out well. Why was Mike unsuccessful on this project? Was it his turn to be on the wrong “tail” of the distribution or did Mike lose his “touch”. If he were a coach would he or should he have been fired?
So is the answer to be good or to be lucky? Mlodinow talks about perseverance as an important key to success. But I like the Roman philosopher, Seneca’s answer: “Luck is a crossroad where preparation and opportunity meet”. So I’m going to keep working on my own leadership skills (preparing) and keep trying new things and try to create my own luck. I encourage you all to do the same, because it can’t hurt to have better leaders leading our projects, teams, groups, and organizations. Together, maybe we can push that central tendency on leadership to the good side of the distribution.